
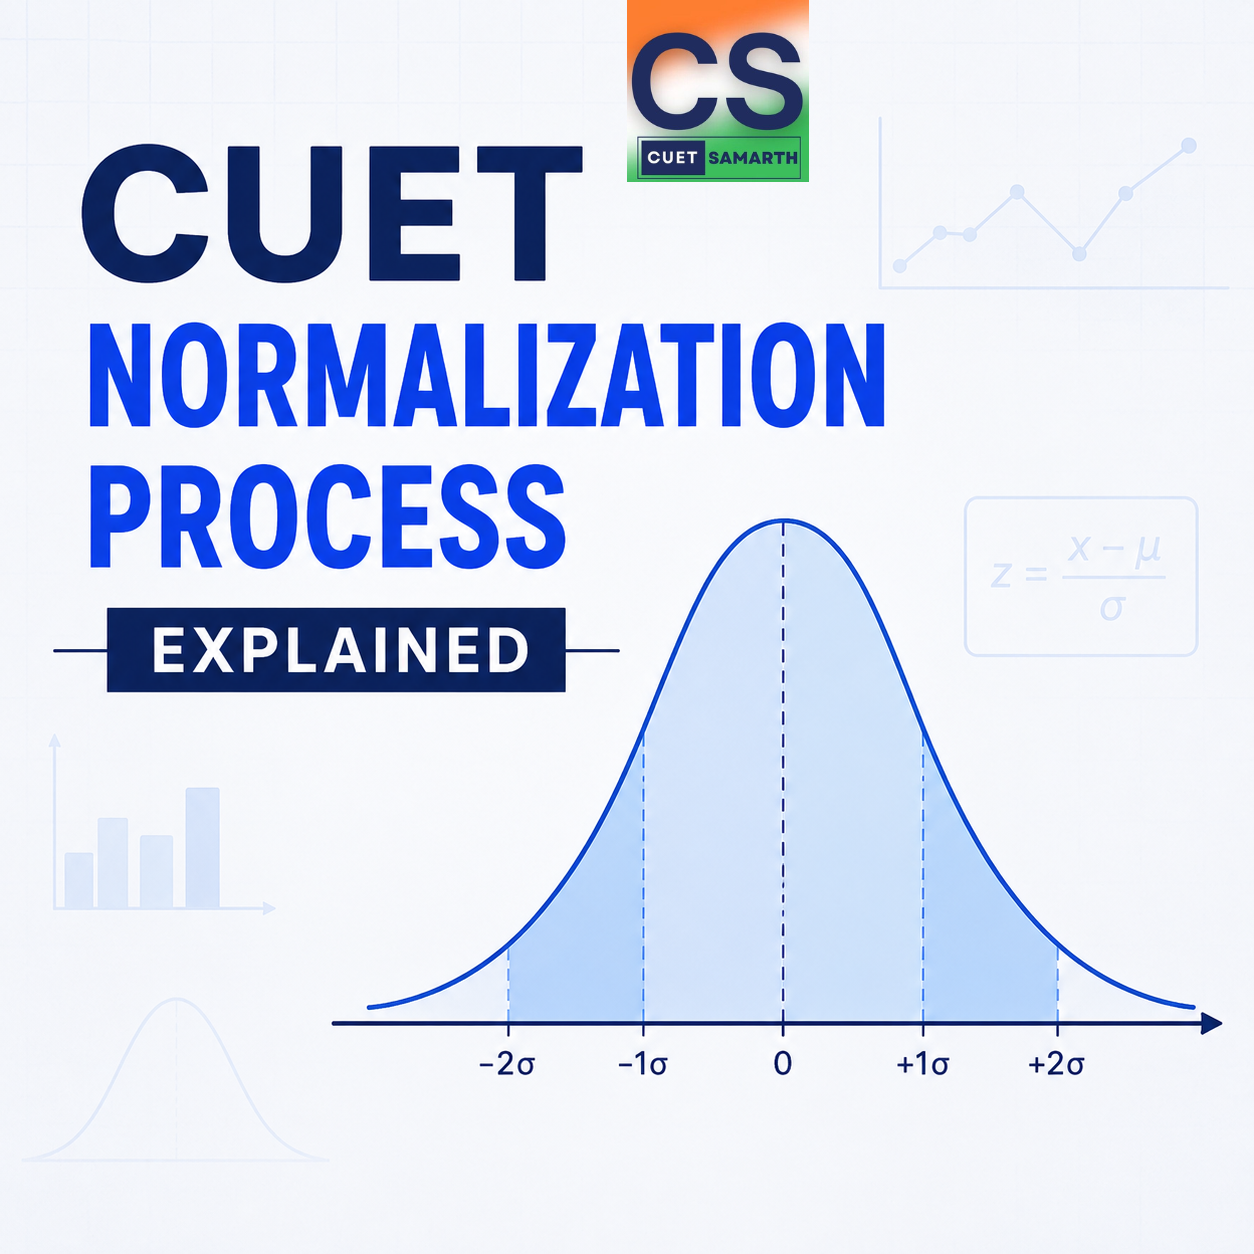
How NTA Equalises Scores Across Shifts, What the Formula Does, and Why Your Raw Mark Is Not Your Final Score
Here is a scenario that plays out every CUET cycle. A student walks out of Shift 1 feeling shaken — their Physics paper had unusually long numericals and what felt like harder assertion-reason questions than expected. Meanwhile, their classmate, who appeared in Shift 2, finished the same subject paper with 20 minutes to spare and calls it ‘easy.’ Both students have the same knowledge. Both studied from the same NCERT textbooks. Yet one faced a harder version of the exam.
If raw scores were the final scores, Shift 2 students would flood the merit lists while Shift 1 students — through no fault of their own — would be ranked lower despite equivalent preparation. CUET Normalization is the mechanism that prevents exactly this outcome. Understanding how it works is not just academic curiosity — it directly determines whether your score goes up, stays level, or how your merit rank is computed across thousands of competing candidates.
This article explains the CUET normalization process from the ground up: what it is, why NTA uses it, the specific statistical method applied, a step-by-step walk-through of the formula, numerical examples, what it means for different types of students, and what you can and cannot do to influence your normalized score.
CUET Normalization 2026 — Quick Reference
| Parameter | Detail |
|---|---|
| What is it? | A statistical procedure that adjusts raw CUET scores to account for paper difficulty differences across shifts and dates |
| Why is it used? | CUET is conducted across multiple sessions; each session’s paper may vary in difficulty; normalization ensures fairness |
| Method used by NTA | Percentile Score Method — score is converted to a percentile position within the session |
| What is normalised? | Subject-level scores for each domain subject, language, and GAT separately |
| Input to formula | Raw score earned by the candidate in their specific session |
| Output of formula | NTA Score (normalised score on a scale of 0 to 100 per subject) and an associated percentile |
| Does it lower scores? | Not necessarily — normalization adjusts both upward and downward depending on session difficulty relative to the overall candidate pool |
| Is it used for merit? | Yes — universities use the NTA Score (normalised) rather than raw marks for computing merit lists |
| Official confirmation | Stated in the CUET UG 2026 Information Bulletin available at cuet.nta.nic.in |
| Applies from which year? | Normalization has been applied in CUET UG since its 2022 launch |
Why Does CUET Need Normalization at All?
A single-day, single-shift examination does not need normalization because every candidate faces the same paper under the same conditions. CUET UG is a fundamentally different beast. With over 15 lakh registered candidates, 37 subjects, and a two-to-three week examination window spanning multiple shifts, it is operationally impossible for NTA to administer identical papers to every candidate simultaneously.
Different sessions mean different question sets, which inevitably means different difficulty levels — even when both papers are drawn from the same NCERT syllabus. A Physics paper with 10 calculation-heavy numerical questions in Shift 1 is objectively harder than a theory-dominant paper in Shift 2, even if both are classified as ‘moderate.’ The candidate who got the harder paper should not be penalised in the merit list simply because their slot had more difficult questions.
Normalization solves this by measuring not what marks a student scored in absolute terms, but where that student ranked within the population of candidates who appeared in their specific session. This relative performance measure — the percentile — then becomes comparable across sessions, because percentile positions are session-independent.
| Without Normalization | With Normalization |
|---|---|
| Student A (Shift 1, hard paper): 185/250 | Student A: positioned at the 82nd percentile of Shift 1 candidates → comparable across all shifts |
| Student B (Shift 2, easy paper): 210/250 | Student B: positioned at the 84th percentile of Shift 2 candidates → comparable across all shifts |
| Merit comparison: B ranked higher despite facing an easier paper | Merit comparison: both positioned near the same relative rank — fairly evaluated |
| Raw score gap of 25 marks creates unfair rank difference | Two-percentile gap reflects genuine performance difference, not paper difficulty difference |
The Normalization Method NTA Uses: Percentile Score Formula
NTA applies the Percentile Score Method for CUET normalization. This is the same approach used for JEE Main normalization since 2019, which means it has been validated across multiple large-scale national entrance examinations before being applied to CUET.
A percentile score is not the same as a percentage score. It is a measure of relative standing within a group — specifically, it tells you what percentage of candidates in your session scored equal to or below your raw marks. The formula converts every candidate’s raw score into a 0-to-100 scale percentile position.
The Percentile Score Formula
| Formula Component | Definition |
|---|---|
| Percentile Score of Candidate X | = (Number of candidates in the session who scored equal to or less than X’s raw score ÷ Total number of candidates who appeared in the session) × 100 |
| Session | The specific shift and date in which the candidate appeared — e.g., 21 May 2026, Shift 1 |
| Raw Score | The actual marks earned by the candidate before normalization (+5 per correct, −1 per wrong, 0 per unattempted) |
| Equal to or less than | The formula includes candidates who scored the same marks as the candidate — this prevents identical-score students from receiving different percentiles |
| Result range | 0.0000000 to 100.0000000 — NTA computes to seven decimal places for precision at scale |
Expressed simply: Percentile Score = (Rank from the bottom in your session ÷ Total candidates in your session) × 100. A percentile of 85.6234512 means 85.62% of candidates in your session scored equal to or below your marks.
Step-by-Step Numerical Example of CUET Normalization
Let us walk through a concrete example using realistic CUET numbers to show exactly how a raw score becomes a normalised NTA Score:
Scenario Setup
| Given Information | Value |
|---|---|
| Subject | Physics |
| Session | 21 May 2026, Shift 1 |
| Total candidates who appeared in this session | 48,000 |
| Candidate Priya’s raw score in this session | 195 out of 250 |
| Number of candidates who scored 195 or less | 41,200 candidates |
Applying the Formula
| Step | Calculation | Result |
|---|---|---|
| Step 1: Identify numerator | Candidates scoring ≤ 195 marks | 41,200 |
| Step 2: Identify denominator | Total candidates appeared in session | 48,000 |
| Step 3: Divide | 41,200 ÷ 48,000 | 0.8583333 |
| Step 4: Multiply by 100 | 0.8583333 × 100 | 85.8333300 |
| Step 5: Round to 7 decimals | NTA Score (Percentile) | 85.8333300 |
| Step 6: Final NTA Score | Priya’s normalised NTA Score for Physics in this session | 85.8333300 |
Priya’s 195 raw marks in Physics — earned in a session that 48,000 candidates appeared for — translates to a normalised NTA Score of 85.83. This is the number that goes onto her scorecard and into university merit calculations. The raw mark of 195 does not appear in the final score — only the percentile position does.
How NTA Merges Scores Across Multiple Sessions for the Same Subject
When the same subject is conducted across multiple sessions — different dates, different shifts — every session produces its own set of percentile scores. NTA then combines these across sessions to produce a single national-level ranking for that subject.
The mechanism is straightforward: since all percentile scores are already expressed on a 0–100 scale relative to the candidate’s own session, comparing Priya’s 85.83 (Physics, 21 May Shift 1) with Arjun’s 83.12 (Physics, 19 May Shift 2) is a valid comparison. Both numbers represent relative performance within their respective session pools. No additional conversion is needed — the percentile format already makes the scores session-neutral.
| Student | Subject | Session | Raw Score | Session Size | Normalised NTA Score | Comparable? |
|---|---|---|---|---|---|---|
| Priya | Physics | 21 May, Shift 1 | 195/250 | 48,000 appeared | 85.8333300 | Yes — percentile positions are session-neutral |
| Arjun | Physics | 19 May, Shift 2 | 188/250 | 52,000 appeared | 83.1245600 | Yes — even though raw scores differ, NTA scores are directly comparable |
| Sneha | Physics | 25 May, Shift 1 | 201/250 | 44,000 appeared | 88.4512700 | Yes — Sneha’s higher percentile reflects stronger performance relative to her session pool |
| Rahul | Physics | 15 May, Shift 2 | 210/250 | 55,000 appeared | 82.7631400 | Yes — Rahul’s high raw score in a session with many high scorers produces a lower percentile than expected |
The counter-intuitive result: Rahul scored 210 raw marks — the highest raw score in the table — but his NTA Score of 82.76 is the lowest. This happens when a candidate appeared in a session where many other candidates also scored high. The percentile method rewards relative performance within a session, not absolute raw marks. Rahul was in a highly competitive session and ended up in the 83rd percentile despite a strong raw score.
What Happens When Two Candidates Have the Same NTA Score?
With 15 lakh candidates and scores computed to seven decimal places, ties do occur — particularly at common score levels. NTA resolves these using a defined tie-breaking hierarchy so that every candidate gets a unique rank:
| Tie-Breaking Priority | Criterion Applied | Rationale |
|---|---|---|
| 1st | Higher NTA Score in Mathematics | Mathematics is the most rigorous quantitative subject in CUET — higher performance here indicates stronger analytical ability |
| 2nd | Higher NTA Score in Physics | Second STEM subject used as a quantitative differentiator |
| 3rd | Higher NTA Score in Chemistry | Third science subject further differentiates tied candidates |
| 4th | Higher NTA Score in the Language paper | Language performance used when all domain subject scores are also tied |
| 5th | Higher NTA Score in any remaining subjects | Broader subject scores considered if earlier criteria remain tied |
| 6th | Date of birth — older candidate ranked higher | Used as a final deterministic differentiator when all subject scores are identical |
| 7th | Alphabetical order of candidate name (first, then last name) | Last resort — purely alphabetical when every other criterion produces a tie |
What Normalization Actually Does to Your Score — Four Scenarios
Students often assume normalization means their score will be adjusted downward if their session was ‘easier.’ This is a misconception. Here is what actually happens across four realistic scenarios:
| Scenario | Session Difficulty | Your Raw Score | Effect of Normalization | Why |
|---|---|---|---|---|
| Scenario 1 | Your session was harder than average | You scored 180 but the session’s highest scorer got 215 | NTA Score likely HIGHER than your raw percentage implies | Because fewer people in your session scored above 180, your percentile position within the session is strong — this gets preserved in the normalised score |
| Scenario 2 | Your session was easier than average | You scored 210 but so did many others in your session | NTA Score may be LOWER than your raw percentage implies | Many candidates in your session scored at or above 210, so your percentile position within the session is lower than your raw mark suggests |
| Scenario 3 | Your session was at average difficulty | You scored close to the session’s mean performance | NTA Score broadly REFLECTS your raw performance | When session difficulty matches the overall average, the percentile conversion produces a score consistent with what your raw marks suggest about your relative standing |
| Scenario 4 | You were the top scorer in your session | You scored the highest raw marks in the session | NTA Score is 100.0000000 | The formula gives 100 percentile to the topper of each session — every candidate scored equal to or below the top scorer |
Key insight: If you appeared in a tough session and scored well relative to your peers in that session, normalization works in your favour. The process does not penalise you for a hard paper — it rewards your relative standing within whoever appeared alongside you.
How Normalised CUET Scores Feed Into University Merit Lists
Once NTA computes and publishes the normalised NTA Scores for each candidate in each subject, universities use these scores to build their admission merit lists. The specific formula varies across institutions — and understanding the formula your target university uses is as important as understanding normalization itself.
| University / Institution Type | Merit Calculation Approach | Which Normalised Scores Are Used |
|---|---|---|
| Delhi University (DU) — B.Tech programs (Faculty of Technology and CIC) | Language NTA Score + Mathematics NTA Score + GAT NTA Score, combined under DU’s prorated CSAS calculation (maximum ~650–700) | Normalised scores for Language, Mathematics, and GAT — Chemistry and Physics NTA scores determine eligibility but are not in the merit formula |
| Delhi University — Arts, Commerce, Science programs | Best of four relevant subjects’ NTA Scores, weighted as per DU’s CSAS system for each specific program | Subject-specific normalised NTA Scores as defined by DU’s program-wise requirement matrix |
| BHU (central university programs) | Aggregate of relevant domain subject NTA Scores (typically 2–3 subject combination depending on program) | Normalised NTA Scores for the specific domain subjects required by each BHU program |
| JMI, JNU, Pondicherry University and other central universities | Each university defines its own combination of NTA Scores for each program — typically 2–3 domain subjects plus language | Normalised NTA Scores for the subjects specified in each university’s 2026–27 admission prospectus |
| Private universities (Amity, LPU, Chandigarh, etc.) | Varies significantly — some use overall aggregate NTA Score, others use subject-specific combinations, others use CUET score alongside their own assessment | Check each university’s official 2026–27 admission brochure for the exact normalised score combination used |
Critical implication: Two candidates with identical raw scores but from different sessions may receive different NTA Scores. And two candidates with different raw scores but from appropriately matched sessions may end up with the same NTA Score. This is normalization working as designed — and it means that checking the official scorecard’s NTA Score (not reverse-engineering from raw marks) is the only reliable way to know your actual merit position.
Six Common Misconceptions About CUET Normalization
Misconception 1 — Normalization Always Lowers Scores
Normalization adjusts scores up or down depending on session difficulty relative to the overall candidate distribution. Students who performed strongly in a difficult session frequently see their effective rank improve after normalization, because their percentile position within a tough session is preserved and carried into the national pool. The direction of adjustment depends entirely on the difficulty of your session relative to other sessions for the same subject.
Misconception 2 — Appearing in an Easy Shift is Always Advantageous
The percentile formula makes this reasoning circular. If an easy shift causes many students to score high, the percentile positions within that session are spread across a compressed high-score range. A score of 210 in a session where 40% of candidates also scored above 200 produces a lower percentile than a score of 195 in a session where only 15% of candidates scored above 195. Session ease benefits everyone in that session equally — it does not create a structural advantage in the final NTA Score.
Misconception 3 — Two Identical Raw Scores Always Produce the Same NTA Score
Identical raw scores produce identical NTA Scores only if both candidates appeared in the same session. Across different sessions, the same raw score produces different NTA Scores because the denominator (session population) and the numerator (candidates who scored equal to or less) both change. A score of 200 marks in a session of 30,000 where 25,000 scored 200 or below gives a different percentile than a score of 200 in a session of 50,000 where 40,000 scored 200 or below.
Misconception 4 — The NTA Score Is Out of 250
The NTA Score is expressed on a 0–100 percentile scale, not on the raw marks scale of 0–250. Raw marks and NTA Scores are two different numbers. A raw score of 210 out of 250 does not become an NTA Score of 84 (which might seem like 84% of 250). The NTA Score is purely a percentile position. A student with raw marks of 195 could have a higher NTA Score than a student with raw marks of 205 if the first appeared in a harder session with a stronger relative rank.
Misconception 5 — Normalization Can Be Gamed by Choosing a Specific Exam Date
NTA assigns exam dates and shifts to candidates — individual candidates do not choose their session. Even in cases where candidates receive a session choice, the percentile formula makes gaming impossible: if many students attempted to cluster into a perceived ‘easy’ session, that session’s competitive pool would intensify, reducing the percentile advantage for each individual. The normalization mechanism is self-correcting by design.
Misconception 6 — A 100 Percentile Means You Got All 50 Questions Right
A 100 NTA Score (100th percentile) means you scored the highest raw marks in your session — not necessarily a perfect score. If the session topper scored 235 out of 250, every candidate who scored 235 or below is equal to or below the topper, and the topper receives a percentile of 100. A perfect 250 is not required for the highest percentile. Conversely, a perfect score in a session where another candidate also scored 250 would produce a tie for 100 percentile, which would then be resolved by the tie-breaking hierarchy.
Has the CUET Normalization Method Changed Across Years?
| Year | Normalization Applied? | Method | Key Notes |
|---|---|---|---|
| CUET UG 2022 | Yes | Percentile Score Method | First year of CUET; normalization was applied from launch; some initial confusion due to candidates unfamiliar with percentile scoring |
| CUET UG 2023 | Yes | Percentile Score Method | Method unchanged; larger candidate pool improved statistical stability of percentile calculations |
| CUET UG 2024 | Yes | Percentile Score Method | Hybrid exam mode (OMR + CBT) meant more sessions; normalization became even more important for fairness across a wider session distribution |
| CUET UG 2025 | Yes | Percentile Score Method | Full CBT mode; normalization continued unchanged; all 50 questions still had internal choice (attempt 40/50) |
| CUET UG 2026 | Yes | Percentile Score Method | Method unchanged; all 50 questions now compulsory — removal of optional choice slightly changes score distribution within sessions but does not alter the normalization formula itself |
Consistency verdict: NTA has used the same Percentile Score Method for CUET normalization across all five years since launch. No change to the fundamental formula has been introduced in 2026. The removal of optional questions affects the raw score distribution within sessions but does not modify how the percentile formula converts those raw scores.
Reading Your CUET 2026 Scorecard: Raw Score vs NTA Score
When your CUET 2026 scorecard is released (expected first week of July 2026), it will display two distinct values for each subject. Understanding the difference between them is essential for interpreting your result and using it correctly in university applications:
| Field on Scorecard | What It Represents | What It Is Used For |
|---|---|---|
| Raw Score | The actual marks you earned based on the +5/−1 scheme before any adjustment — this is the number you can calculate yourself by counting correct and wrong answers | Not used for university merit lists directly; useful for self-evaluation and understanding your performance |
| NTA Score (Normalised Score) | Your percentile position within your session — expressed on a 0–100 scale to seven decimal places | This is the number universities use for merit lists, cutoff comparisons, and admission rank calculations |
| Subject-wise Percentile | Your NTA Score expressed as a percentile statement — e.g., 85.6234512 means you scored equal to or above 85.62% of candidates in your session | Used for understanding relative performance and eligibility thresholds at participating universities |
| Overall Percentile | A combined percentile across all subjects attempted, computed using a specific multi-subject weighting formula that varies by program | Some universities and counselling portals use overall percentile for program-level filtering; check each university’s requirement |
What Can You Actually Do to Maximise Your Normalised Score?
The honest answer is that the normalization formula is outside your control. You cannot choose your session, you cannot predict your session pool’s difficulty, and you cannot game the percentile formula. What you can control — and what produces the best possible normalised score — is your relative performance within whatever session you are assigned to. Here is how:
- Maximise correct attempts in your session: The percentile formula rewards relative performance. Getting more questions right than other candidates in your session moves you up the percentile distribution regardless of how easy or hard the paper felt. Every additional correct answer improves your rank within your session pool.
- Never leave questions blank: With all 50 questions compulsory in CUET 2026 and a positive expected value on even a random guess (+1.0 expected marks per blank-turned-guess), unattempted questions are a direct concession of rank within your session. Attempting all 50 questions — using elimination before guessing — is the most reliable way to maximise raw score, which maximises your percentile position.
- Focus on Chapter-level consistency, not peak performance on easy chapters: A score of 195 distributed evenly across hard and easy chapters often produces a better session percentile than a score of 210 concentrated in the easiest questions of an easy paper. Broad NCERT coverage produces more consistent correct answers across question types, which is what the percentile formula rewards.
- Use timed mock papers to simulate session performance: Your percentile depends on how you perform relative to thousands of other candidates under the same 60-minute pressure. Practising full papers under timed conditions develops the exam-pace consistency that translates directly into higher session-relative performance on exam day.
- Do not waste energy worrying about which session is harder: You cannot change your assigned session, and the normalization formula accounts for session difficulty automatically. The highest-leverage activity available to you is scoring as many correct answers as possible in your specific session — not trying to predict or influence which session you appear in.
Frequently Asked Questions — CUET Normalization Process
Q1. Will normalization help me if my CUET paper was genuinely harder than other shifts?
Yes — this is exactly the scenario normalization is designed for. If your session paper was harder, fewer candidates in your session scored high marks. This means that even a moderate raw score places you at a relatively strong percentile within your session. That percentile is what gets compared nationally. Students who appeared in genuinely harder sessions are not structurally disadvantaged under the percentile method — their relative performance within that session is what counts.
Q2. My friend got 210 marks in Physics and I got 195, but my NTA Score is higher. How is this possible?
Your friend appeared in a session where many candidates also scored high, which placed them at a lower percentile within that session despite the strong absolute marks. You appeared in a session where fewer candidates scored above 195, which placed you at a higher percentile within your session. Since NTA Scores are percentiles within sessions rather than raw marks, your stronger session-relative performance produced a higher NTA Score even with a lower raw score. This is the normalization system working correctly.
Q3. Does NTA publish the session-wise difficulty data or the raw score distributions?
NTA does not publish detailed session-wise difficulty breakdowns or raw score frequency distributions. Only the final NTA Scores (normalised percentile scores) appear on scorecards. Candidates receive their own raw score information via the response sheet and answer key, from which they can calculate their own raw marks, but the session-pool data required to replicate the percentile calculation is not publicly released.
Q4. If I challenge the answer key and it is accepted, does my normalised score get recalculated?
Yes. When NTA accepts a challenge to the provisional answer key, it revises the final answer key and recomputes raw scores for all affected candidates in all sessions. This raw score revision triggers a full recalculation of the percentile distribution within each affected session. The new normalised NTA Scores are then published alongside the final answer key. This is why the final result is released after the answer key challenge window closes — the recalculation requires the complete and final answer key.
Q5. Does normalization apply to all CUET subjects, including languages and GAT?
Yes — normalization via the percentile method is applied to every subject section in CUET UG: Section IA (languages), Section II (domain subjects), and Section III (General Aptitude Test). Each subject is normalised independently based on the sessions in which it was conducted. The NTA Score on your scorecard represents the percentile position within your session for each subject separately.
Q6. Can my NTA Score be 100 if I did not get a perfect raw score of 250?
Yes. An NTA Score of 100 (100th percentile) simply means you scored the highest raw marks among all candidates who appeared in your specific session for that subject. If the session topper scored 237 out of 250, that candidate receives an NTA Score of 100 because 100% of candidates in that session scored equal to or below 237. A perfect 250 is not required for the top percentile in any session.
Q7. Will my CUET 2026 scorecard show my raw marks or only the NTA Score?
Your CUET 2026 scorecard will show both your raw marks (calculated from the final answer key) and your NTA Score (normalised percentile score) for each subject. Raw marks allow you to verify your performance against the answer key. NTA Scores are what universities use for merit list calculations and what you should focus on when estimating your admission prospects.
Conclusion: Normalization Is the Fairness Engine of CUET
The CUET normalization process is not a black box designed to confuse students — it is a well-established statistical mechanism with a transparent formula that serves a clear purpose: making scores earned across different papers, different shifts, and different dates comparable on a single national scale.
The percentile formula rewards relative performance. A student who outperforms their session peers, regardless of whether that session was hard or easy, earns a strong NTA Score. A student who underperforms relative to their session peers, even in an easy session, earns a lower NTA Score. This is fair, mathematically sound, and consistent across all five years of CUET’s operation.
For candidates, the practical takeaway is uncomplicated: focus entirely on maximising the number of questions you answer correctly in your assigned session. The formula will handle the rest. Your competition is the candidates who appeared in your shift — beat them, and normalization will faithfully reflect that performance in your NTA Score.
Stay updated on CUET 2026 answer key releases, scorecard downloads, and university-wise NTA Score cutoff analysis at cuetsamarth.com.